NH DES Volunteer Lake Assessment Program (VLAP)
Volunteers take water samples on Lake Waukewan as part of the State of New Hampshire's Volunteer Lake Assessment Program (VLAP).
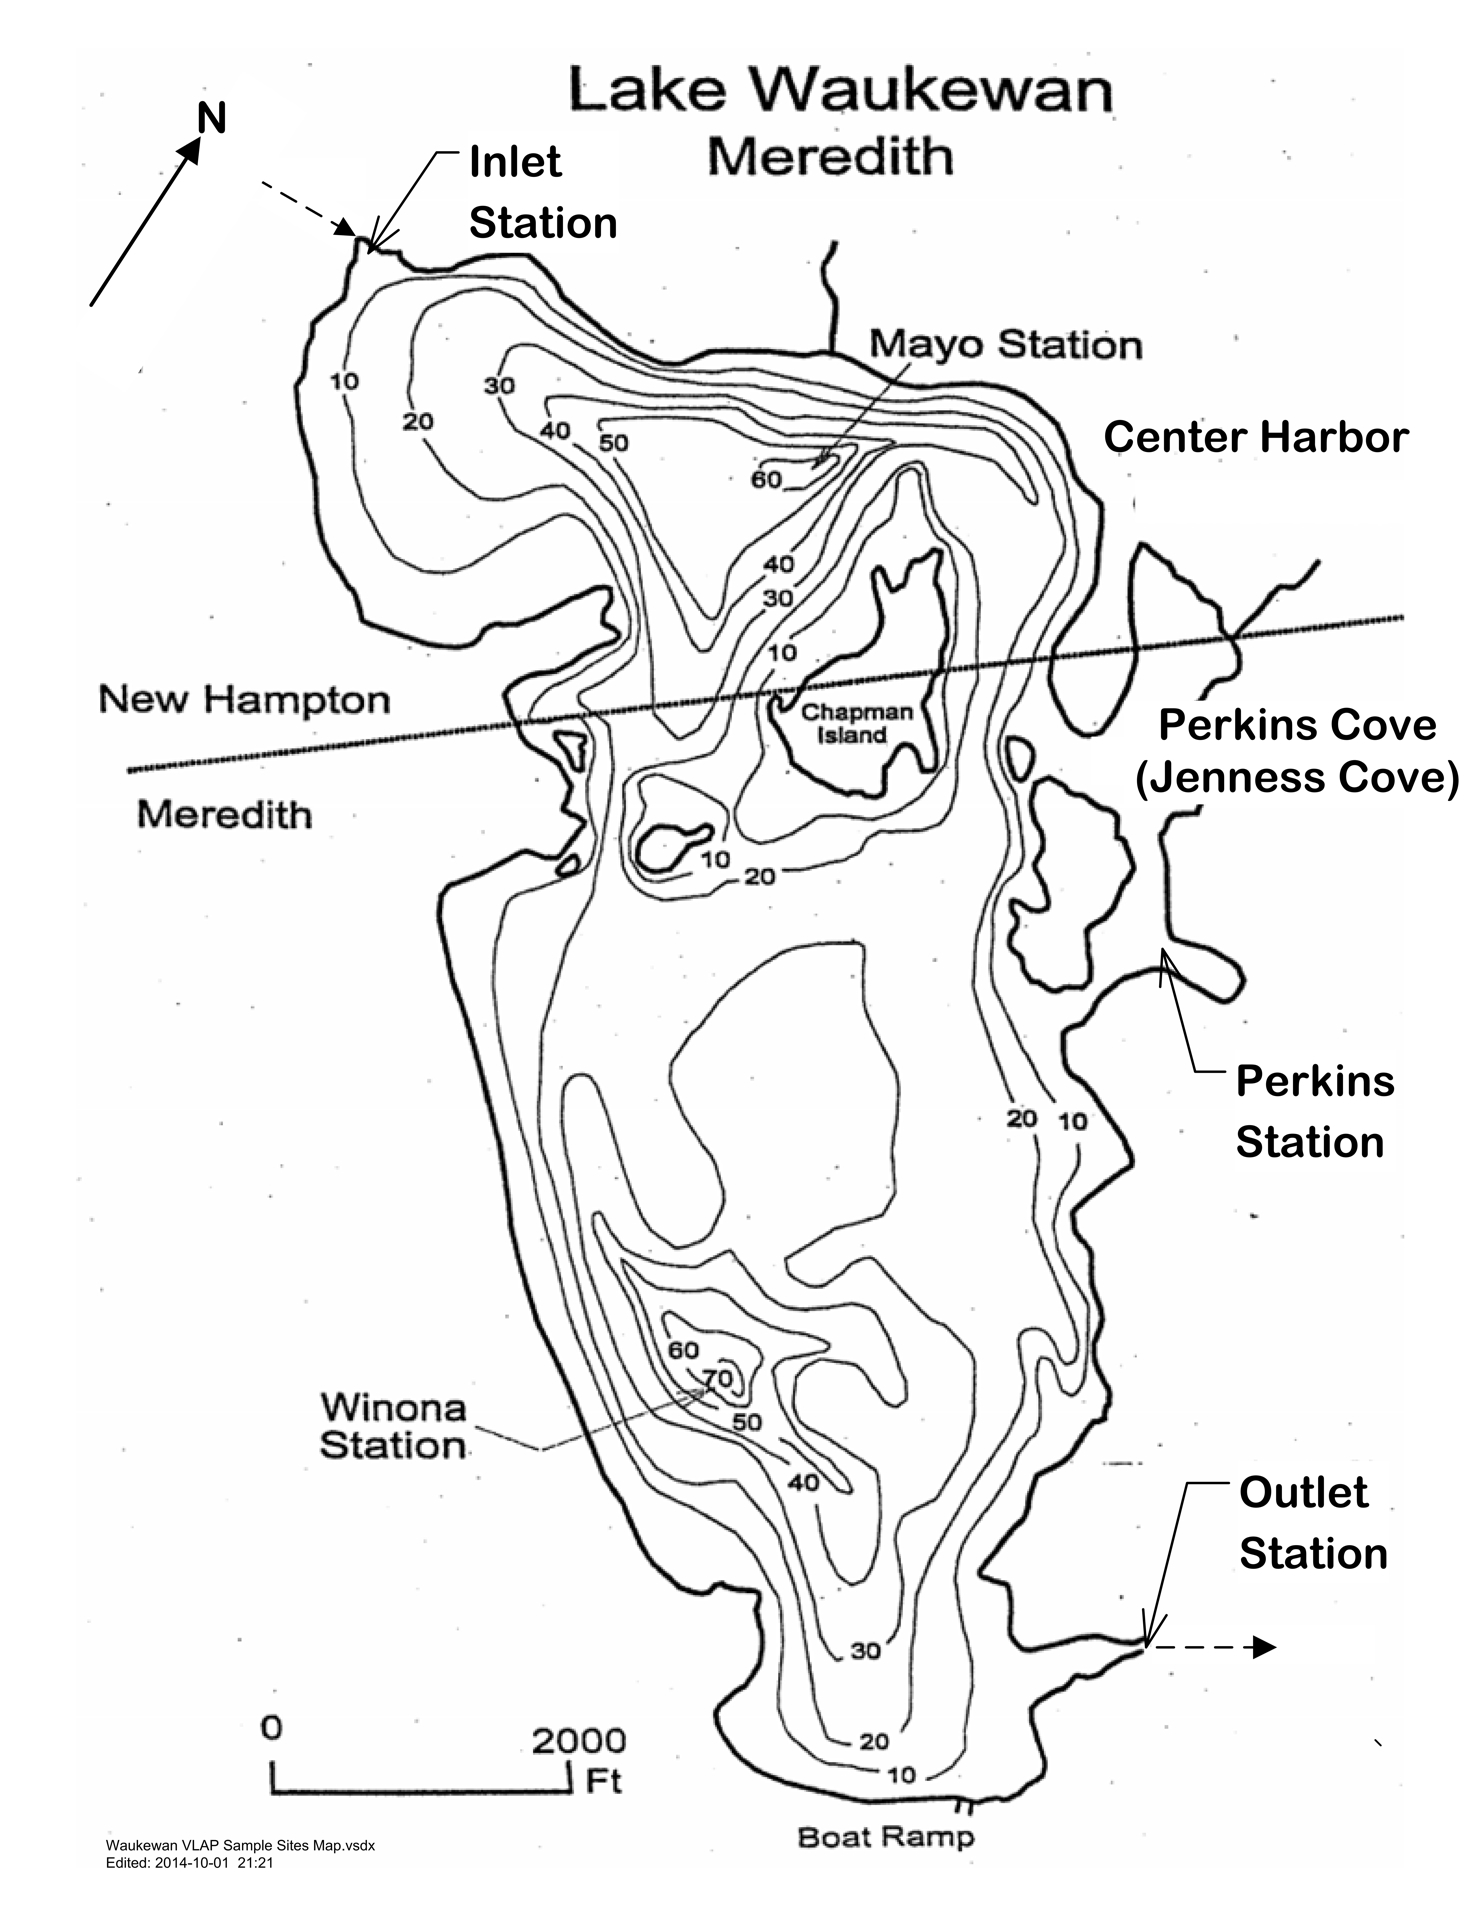
The water sampling is done three times per season -- typically in early July, August and September. The volunteer drives to Concord to borrow some of the test equipment from the State Lab, takes samples from five locations on Lake Waukewan and then gets the samples and equipment back to the State Lab in Concord in a timely manner for testing. Someone from the state's Department of Environmental Services (DES) comes out every other year to assist in the first sampling of the season and take additional measurements. The DES provides a training session in Concord, typically in June for new volunteers. |
DES VLAP Information2023 VLAP Reports
The 2022 Individual Lake Report for Lake Waukewan and a document to help you interpret your report. Your VLAP report WILL be posted in the document library on the NHDES website later this spring. For now, your report will be posted to the Lake Information Mapper. There’s also a lot of other information here, so please utilize the mapper to your advantage!
This is the compilation data analysis for the summer months only. Other non-summer testings will be reported separately but they are for now isolated data points only. You might note on the graph for temperature and the fairly dramatic decrease in oxygen noted at the deeper levels, as well as DES's disturbing analysis of same. Fortunately, the recent Town financed purchase of our own Dissolved Oxygen meter has come to pass and we will incorporate this into our regular test panel. Might well be revealing.
2021 VLAP Reports
2020 VLAP Reports
2017 Sara Steiner's Reported Changes• The report card on the front of the report has been updated with data from the period 2006-2015 which is what is contained in the most recent draft 2016 surface water quality assessments. You may notice a change in the report card based on this. Don't hesitate to ask if you have questions.
• The graphic containing the annual chlorophyll-a, phosphorus and transparency data has changed to include reference lines for the thresholds associated with chlorophyll and phosphorus data based upon your lake's best trophic classification. The thresholds are what the report card on the front of your report is referencing when assessing chlorophyll and phosphorus for aquatic life use. I hope this makes it easier to visualize how frequently your data may exceed the thresholds or whether the data fall below the thresholds. 2019 VLAP Reports
2018 VLAP Reports
2017 VLAP Reports
Other VLAP Reports and InformationOverview Fact Sheet How to determine ice-out How to read your VLAP report Publications Report for Snake River (2015) Report for Snake River (2016) Report for Lake Waukewan - Winona Station (2015) Report for Lake Waukewan - Winona Station (2016) Report for Lake Waukewan - Mayo Station (2015) Report for Lake Waukewan - Mayo Station (2016) Report for Lake Winona (2015) Report for Lake Winona (2016) Map of sampling locations - PDF Map of sampling locations - PNG | ||||||||||||||||||||||||||||||||||||||